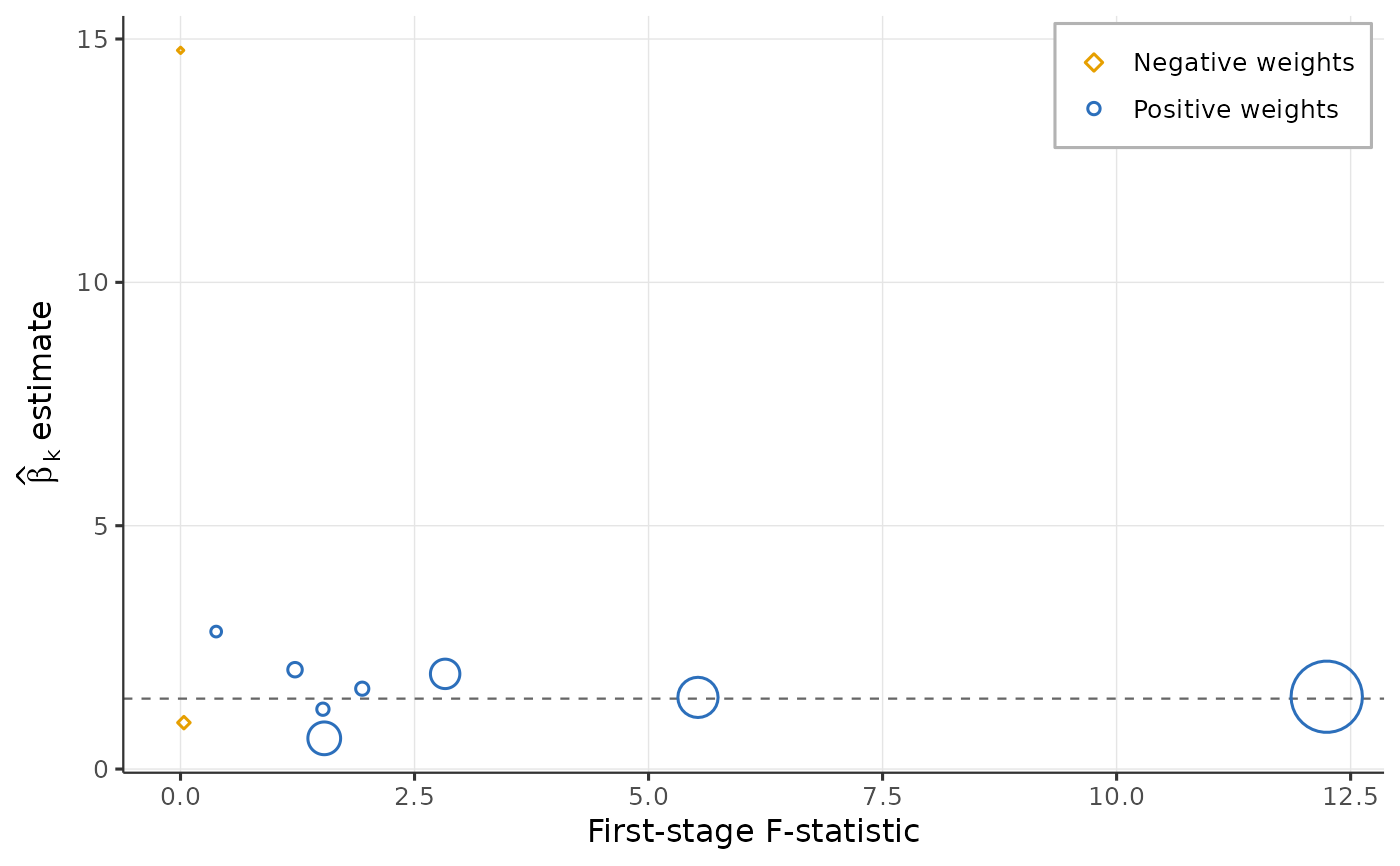
Reproduces Figure 1 of Goldsmith-Pinkham, Sorkin and Swift (2020): each sector-cell is a bubble at its first-stage F-statistic (x) and just-identified estimate \(\hat\beta_n\) (y); bubble area is proportional to the absolute Rotemberg weight; positive-weight cells are blue open circles and negative ones amber open diamonds; the dashed horizontal line marks the overall estimate \(\hat\beta\).
Examples
sim <- ssb_simulate(n_loc = 80, n_sec = 10, seed = 1)
d <- ssb_design(sim$data, sim$shares, sim$shocks, exogenous = "share")
ssb_plot_rotemberg(ssb_rotemberg(d))