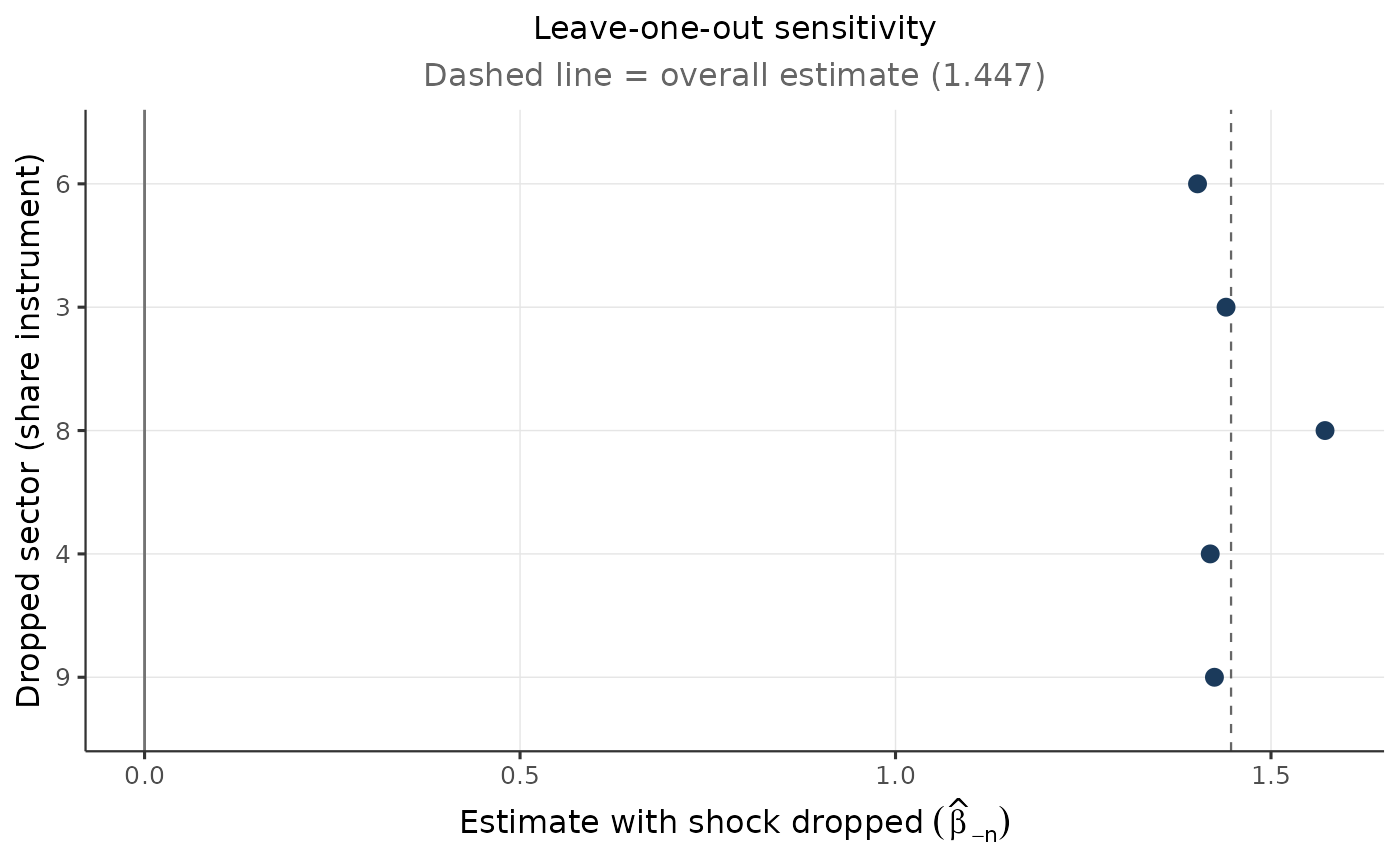
Plots the shift-share estimate re-computed with each top-|Rotemberg-weight| share instrument (sector) dropped (see [ssb_loo()]) against the full estimate (dashed line), so a result that hinges on a single sector's share is obvious.
Examples
sim <- ssb_simulate(n_loc = 80, n_sec = 10, seed = 1)
d <- ssb_design(sim$data, sim$shares, sim$shocks, exogenous = "share")
ssb_plot_loo(ssb_loo(d, top = 5))