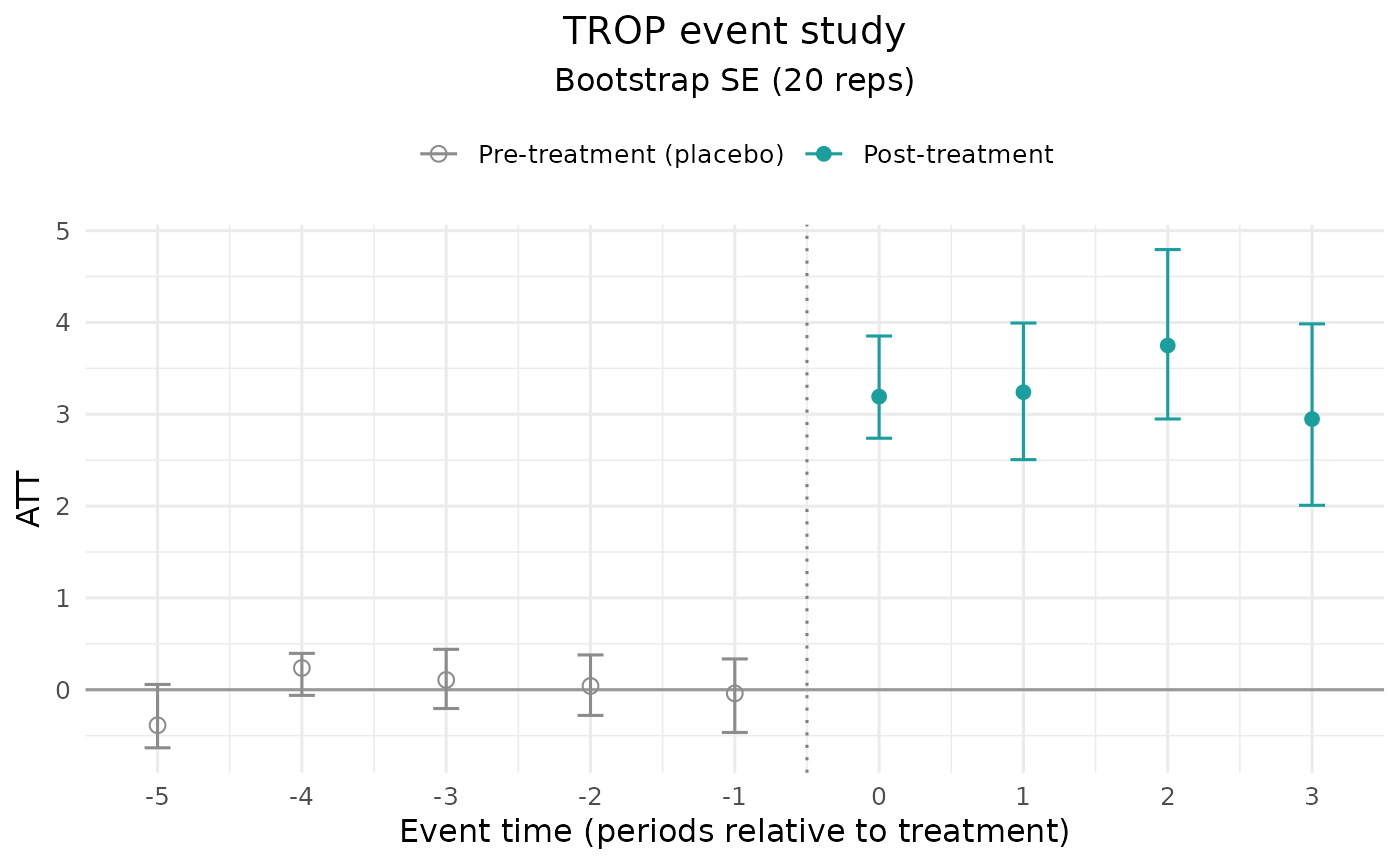
Plots the per-period treatment effects from trop_event_study() against event
time, with pointwise confidence-interval bars, a solid line at zero, and a
dotted line marking treatment onset. When pre-treatment periods are present
they are drawn as distinct placebo / pre-trend points (open markers) so the
pre-period profile can be read at a glance. The SE method is named at the end
of the subtitle.
Usage
# S3 method for class 'trop_event_study'
autoplot(object, ...)
Arguments
- object
A
trop_event_studyobject fromtrop_event_study().- ...
Unused.
Examples
# \donttest{
df <- sim_panel(N = 16, T = 9, n_treated = 4, t0 = 6, att = 3, seed = 1)
# fixed penalties keep the example fast; omit `lambda` to cross-validate
fit <- trop(df, "y", "w", "id", "t", se = "none",
lambda = list(time = 0.1, unit = 0.5, nn = 2))
autoplot(trop_event_study(fit, se = "bootstrap",
control = trop_control(n_boot = 20L, seed = 1)))
 # }