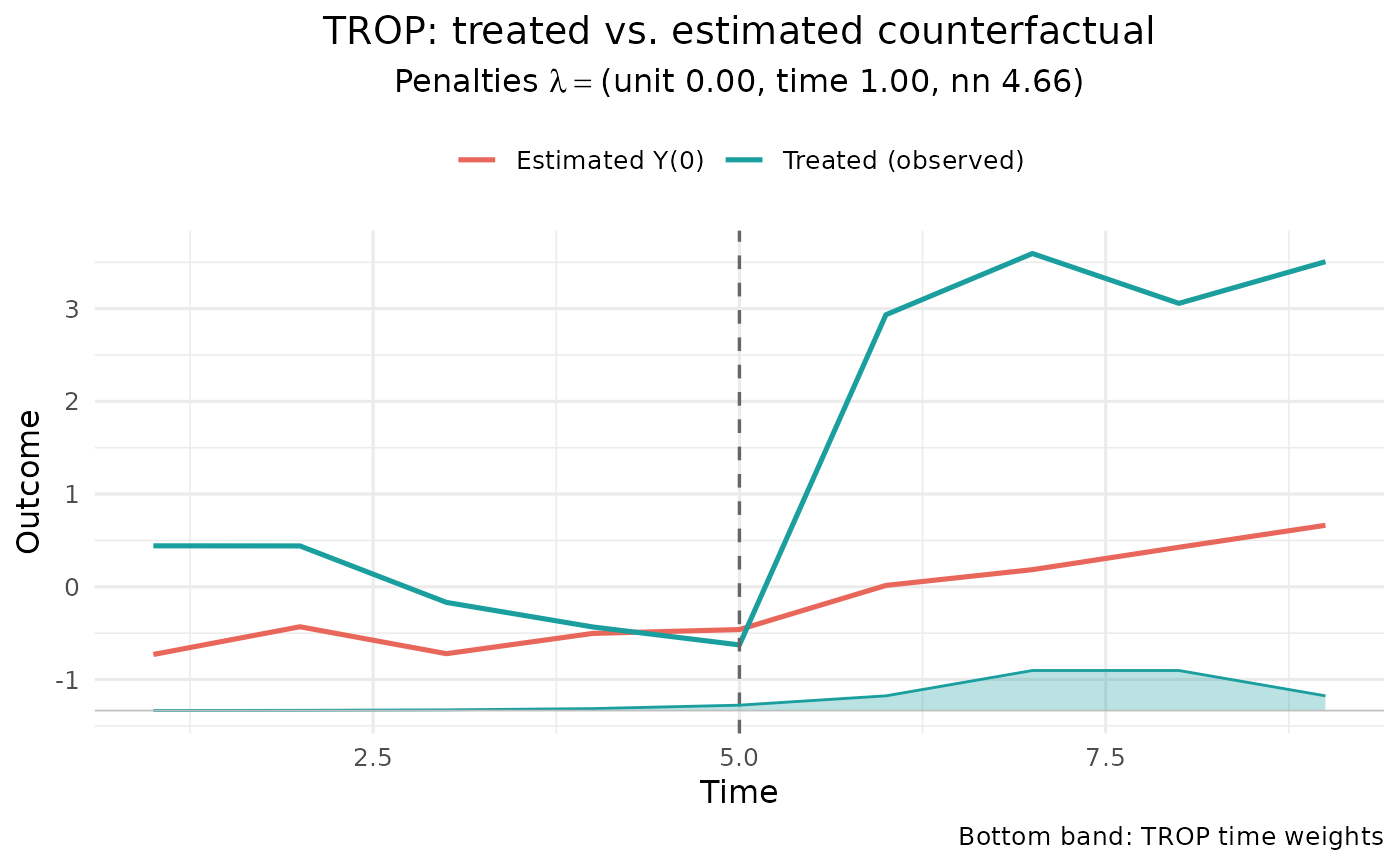
Draws the treated-unit average observed path against the estimated untreated (counterfactual) path, in the style of the synthdid plot: a dashed line marks the last pre-treatment period, the post-treatment gap between the two lines is the estimated effect, and – since TROP carries explicit time weights – the time weights \(\theta_s = \exp(-\lambda_{time} |t - s|)\) are drawn as a filled band along the bottom (as in synthdid's time-weight strip) to show which periods the counterfactual leans on. The band shows weights, not observation counts; heights are scaled to the largest weight, and with \(\lambda_{time} = 0\) the weights are uniform and the band is flat.
Usage
# S3 method for class 'trop'
autoplot(object, show_weights = TRUE, show_se = FALSE, ...)
Arguments
- object
A
tropfit fromtrop().- show_weights
Logical; draw the time-weight band along the bottom.
- show_se
Logical; append the fit's standard-error method to the subtitle. Defaults to
FALSEbecause this plot does not display standard errors – seetrop_event_study()for the uncertainty visualisation.- ...
Unused.
Details
This is a point-estimate trajectory: it shows no standard errors or
confidence intervals (the post-treatment gap is left unshaded so it is not
mistaken for a confidence band). To visualise the fit's uncertainty, use
trop_event_study() and call autoplot() on the result, which draws
per-period estimates with pointwise confidence bars. Accordingly the subtitle
reports only the selected penalties by default; set show_se = TRUE to also
note which standard-error method the fit used.
See also
trop_event_study() and its autoplot() method for per-period
effects with confidence bars.
Examples
# \donttest{
df <- sim_panel(N = 14, T = 9, n_treated = 3, t0 = 6, att = 3, seed = 1)
autoplot(trop(df, "y", "w", "id", "t", se = "none",
control = trop_control(n_cv_cells = 5L, cv_cycles = 1L,
tol = 1e-3, seed = 1L)))
 # }